 QDev
QDevSee what's inside
without expanding it.
A collapsed object or array isn't a dead end. QDev shows a compact peek of its contents inline, a fuller popover on hover, and the same hints on graph nodes — so you can scan a document without opening every branch.
The inline peek
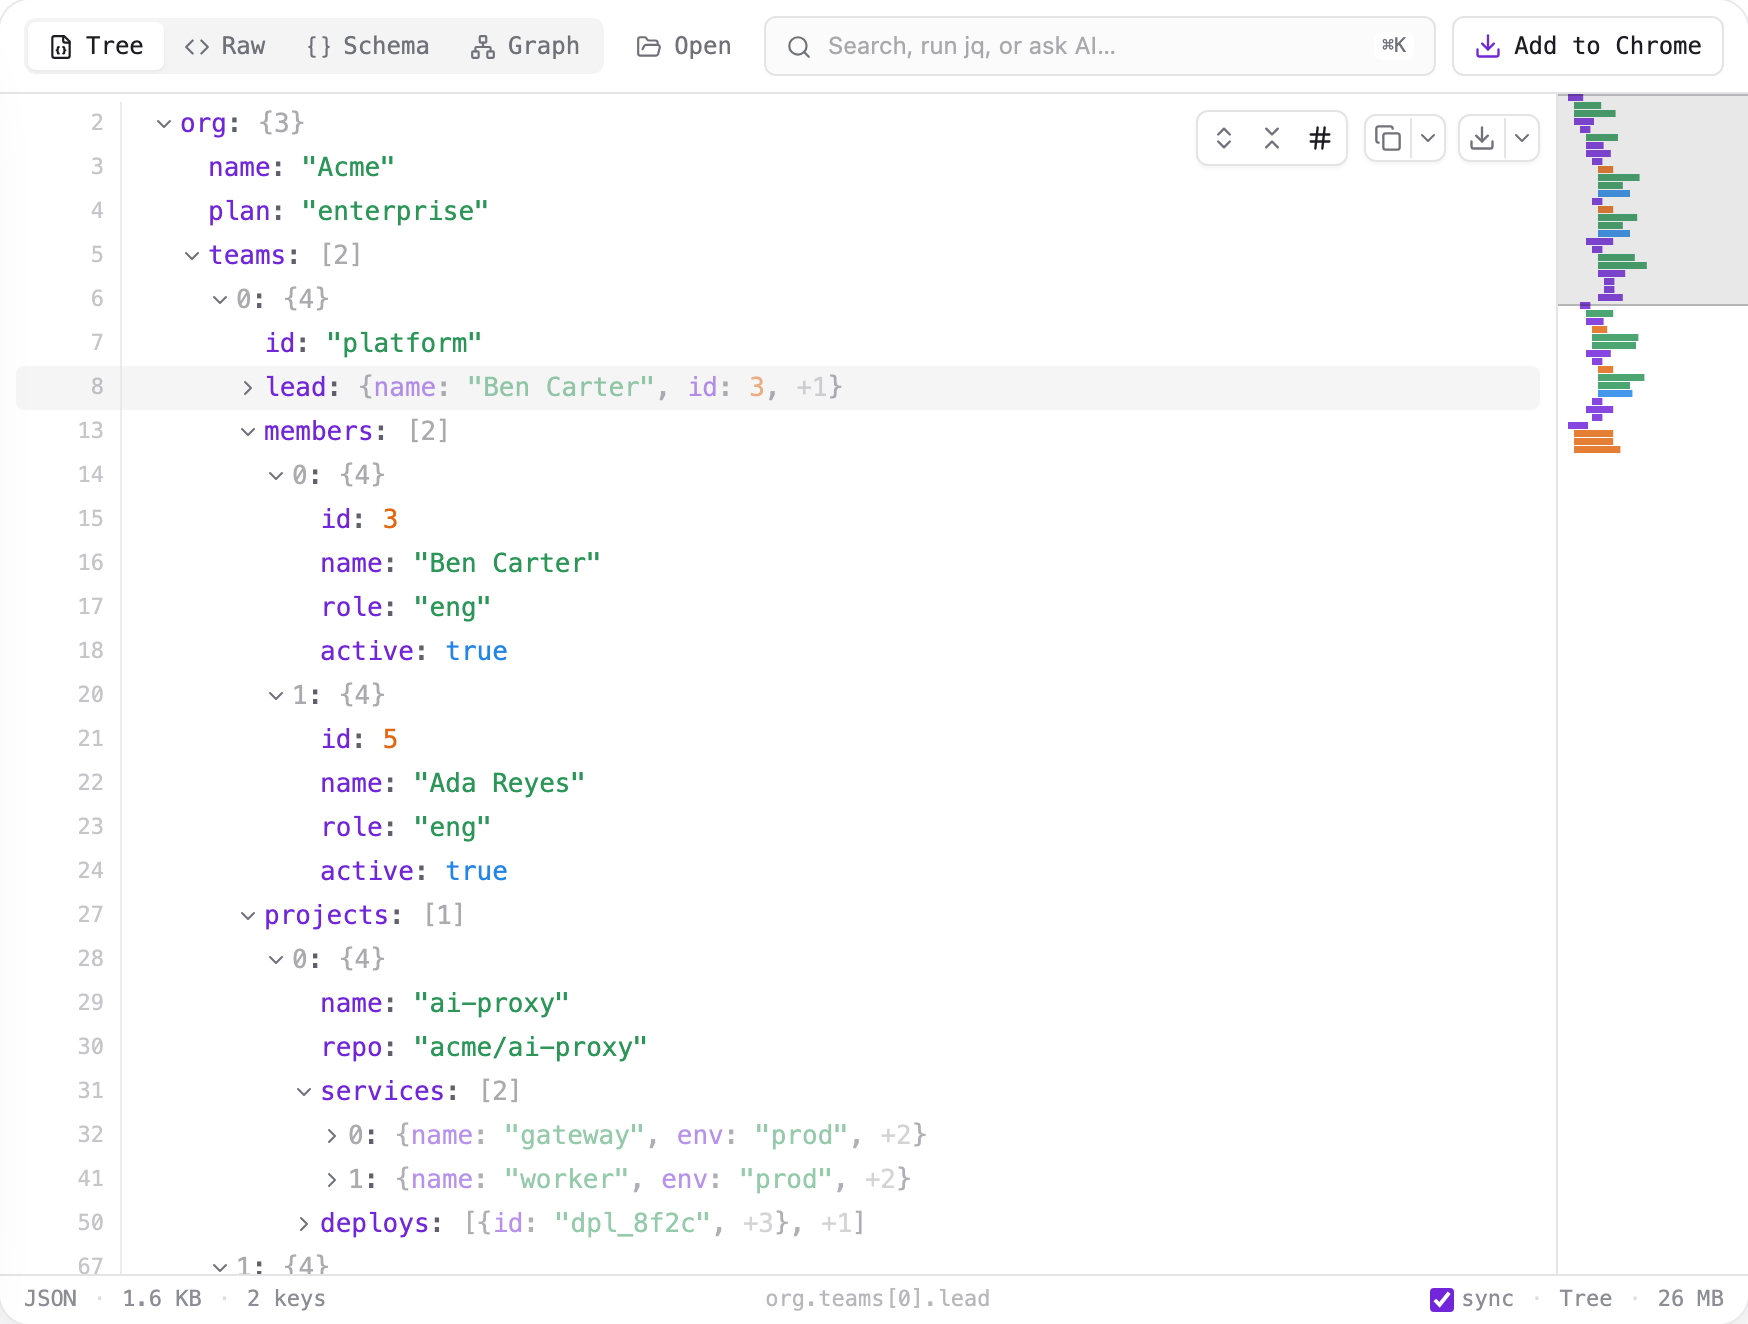
When a container is collapsed, its row shows a one-line summary of what's inside — the first few members, recursing one level into nested containers, then +N for the rest:
The peek leads with an identifying field when it can find one — a name, title, id, or similar — so the summary is actually useful, not just the first key alphabetically. Values are clipped to keep it to one line, and a node that's still streaming (not yet loaded) shows a plain {…} or […]until it's available.
Hover for more
Hover the inline peek of a collapsed object and a popover opens with a fuller, vertical view — the field count, up to eight key/value pairs (each value clipped to a readable length), then +N more. It flips above or below the row to stay on screen. Arrays don't get the popover — their inline peek already reads top to bottom.
Links, images, colors & dates
QDev recognizes what a string value is and upgrades it in place — in the tree, the table, and the columns view alike:
http(s) value becomes a real link — click to open it in a new tab. A string that merely mentions a URL mid-sentence stays plain text..png, .svg, .webp, …) and data:image/…values show a thumbnail on hover, with the image's dimensions. In the columns view, the detail panel shows the image itself.#7c3aed), rgb(), and hsl() literals get an inline swatch, so a palette reads as one at a glance.exp/iat humanized. Decoding happens in the tab; the signature is not verified.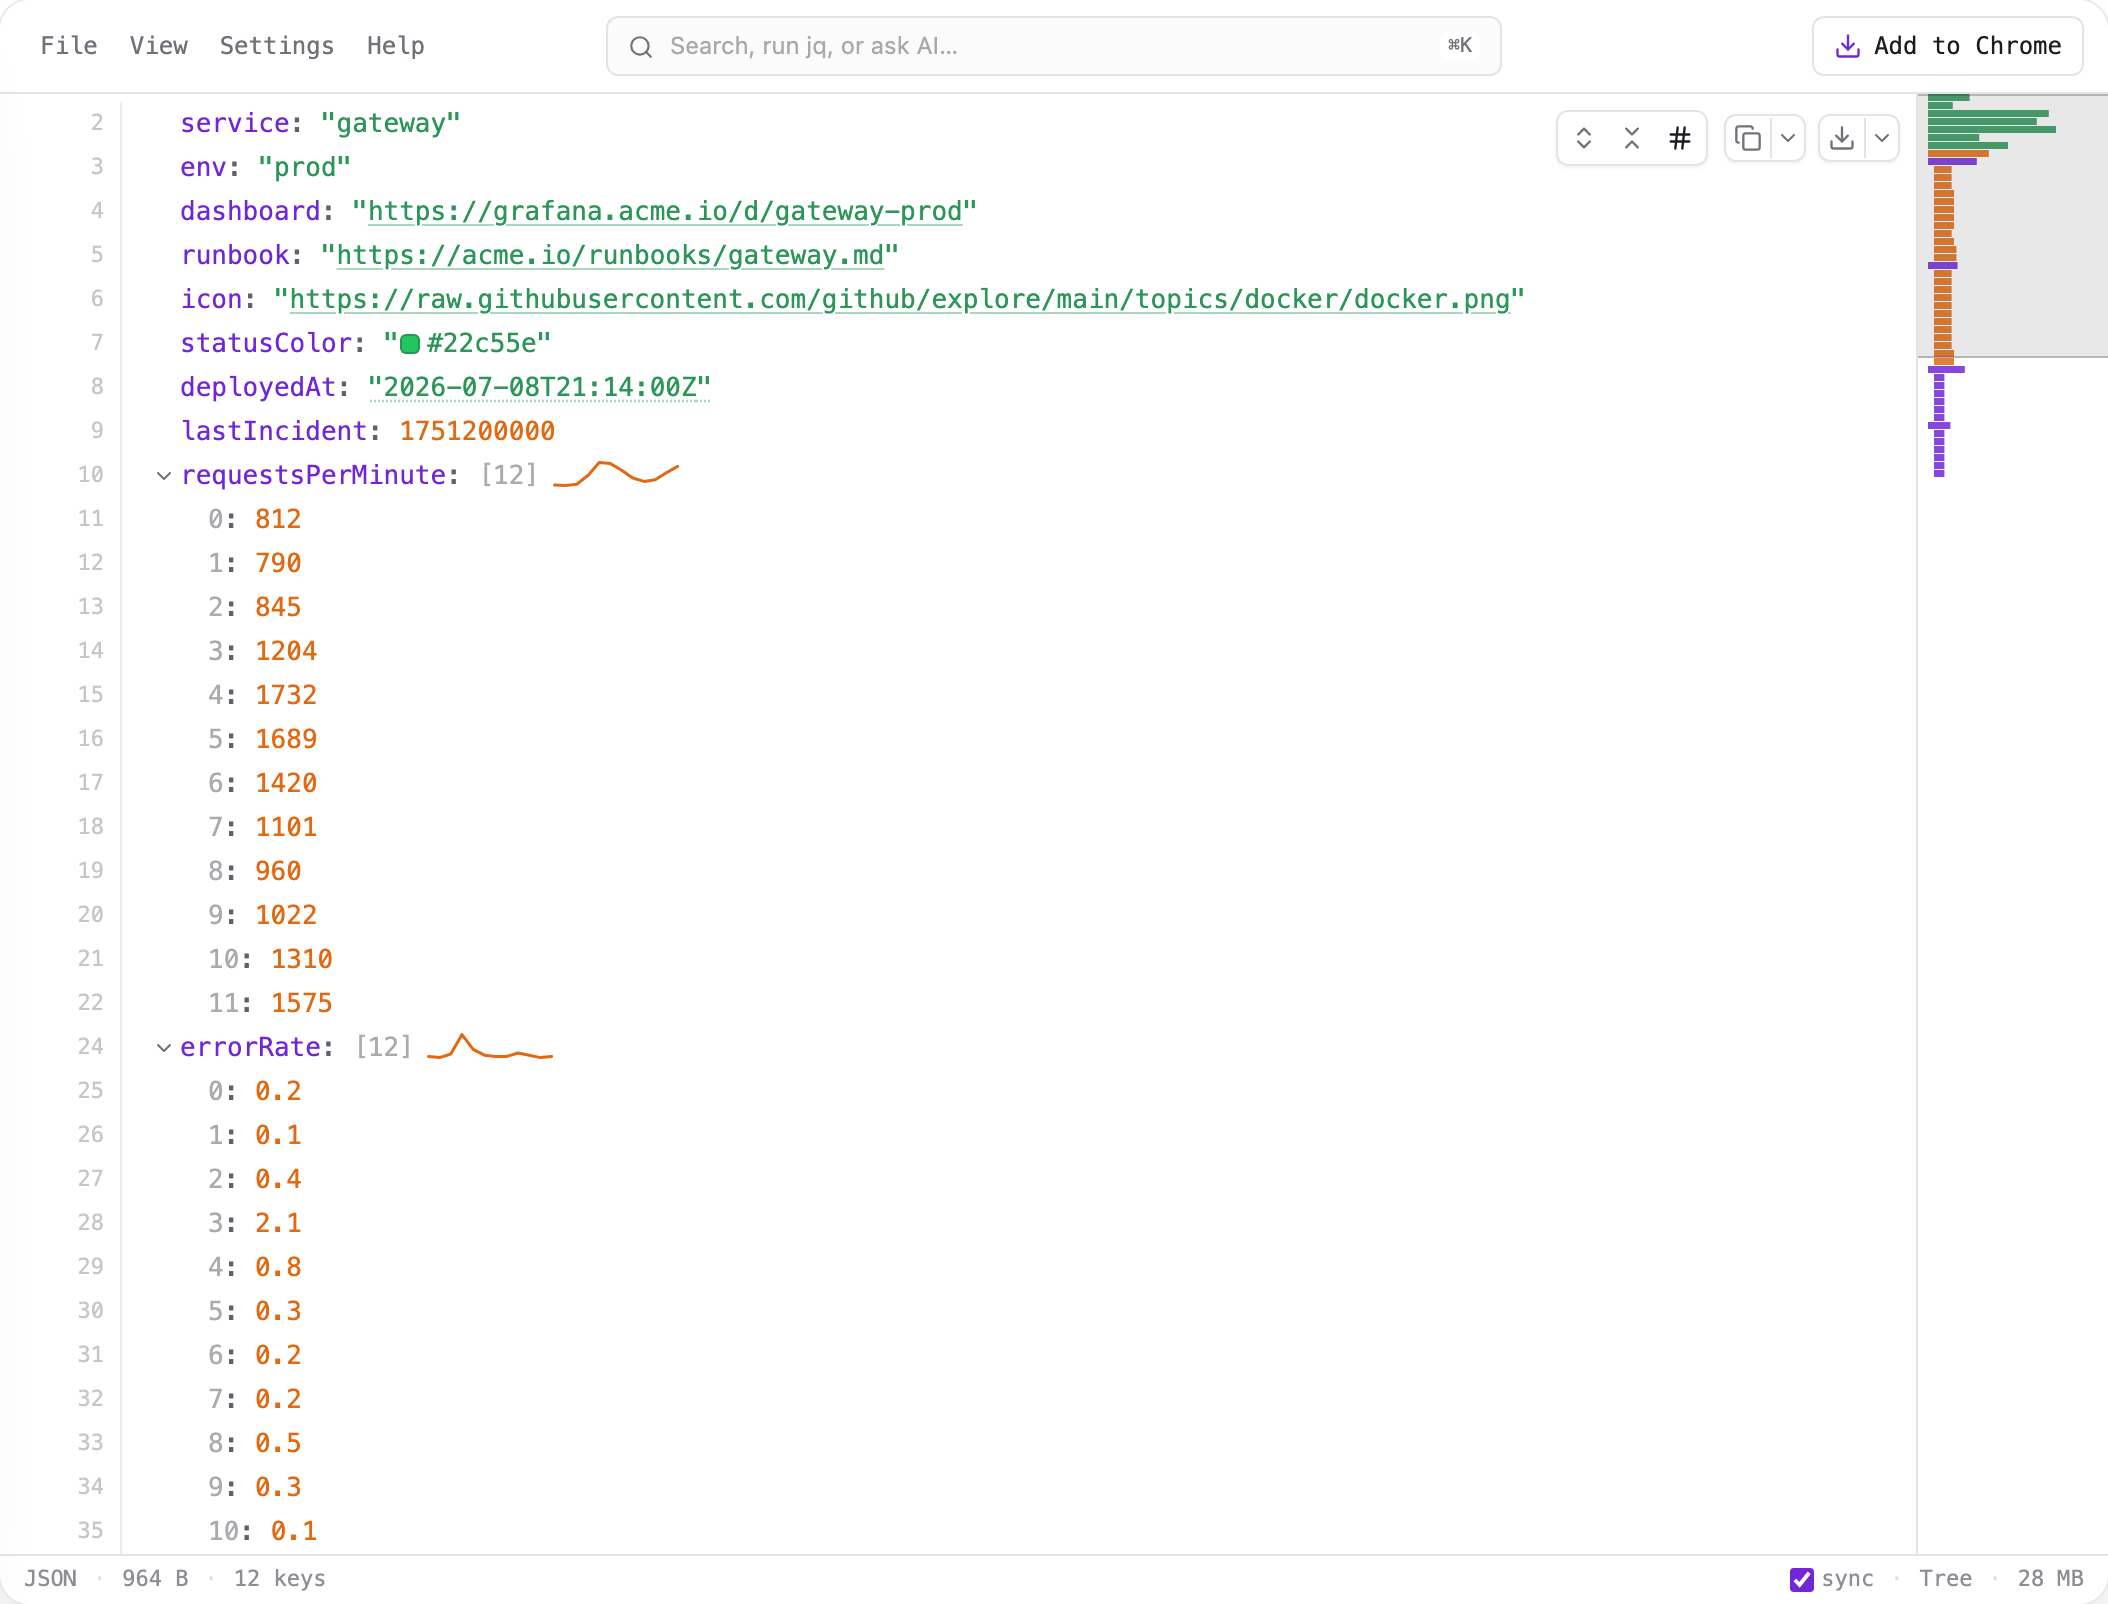
Detection runs entirely in the tab and never fetches anything on its own — an image loads from its host only when you hover it. See privacy for the full picture.
Time series & sparklines
An array that reads as a series gets a sparkline right on its row — next to the inline peek when collapsed, next to the [n] count when expanded, and inside table and columns cells. Three shapes are recognized: plain numbers, [timestamp, value] pairs, and arrays of objects with a time-like field (ts, timestamp, date, …) plus a numeric field. Timestamps can be ISO strings or unix seconds/milliseconds.
Hover a collapsed series for a quick card — the shape, min/max/last, the point count, and the time range. Click the sparkline for the full chart: a crosshair follows your pointer and snaps to the nearest point, ←/→ step through points, and Esc closes it.
The chart has three forms — Line, Bars (better for short, discrete series), and Distribution, a histogram of the values (where do the latencies cluster?). Drag across the line or bars plot to filter to that range — the stats and the distribution rebin to the window, and Reset restores the whole series. When the records carry several numeric fields, field chips above the plot switch which one is charted.
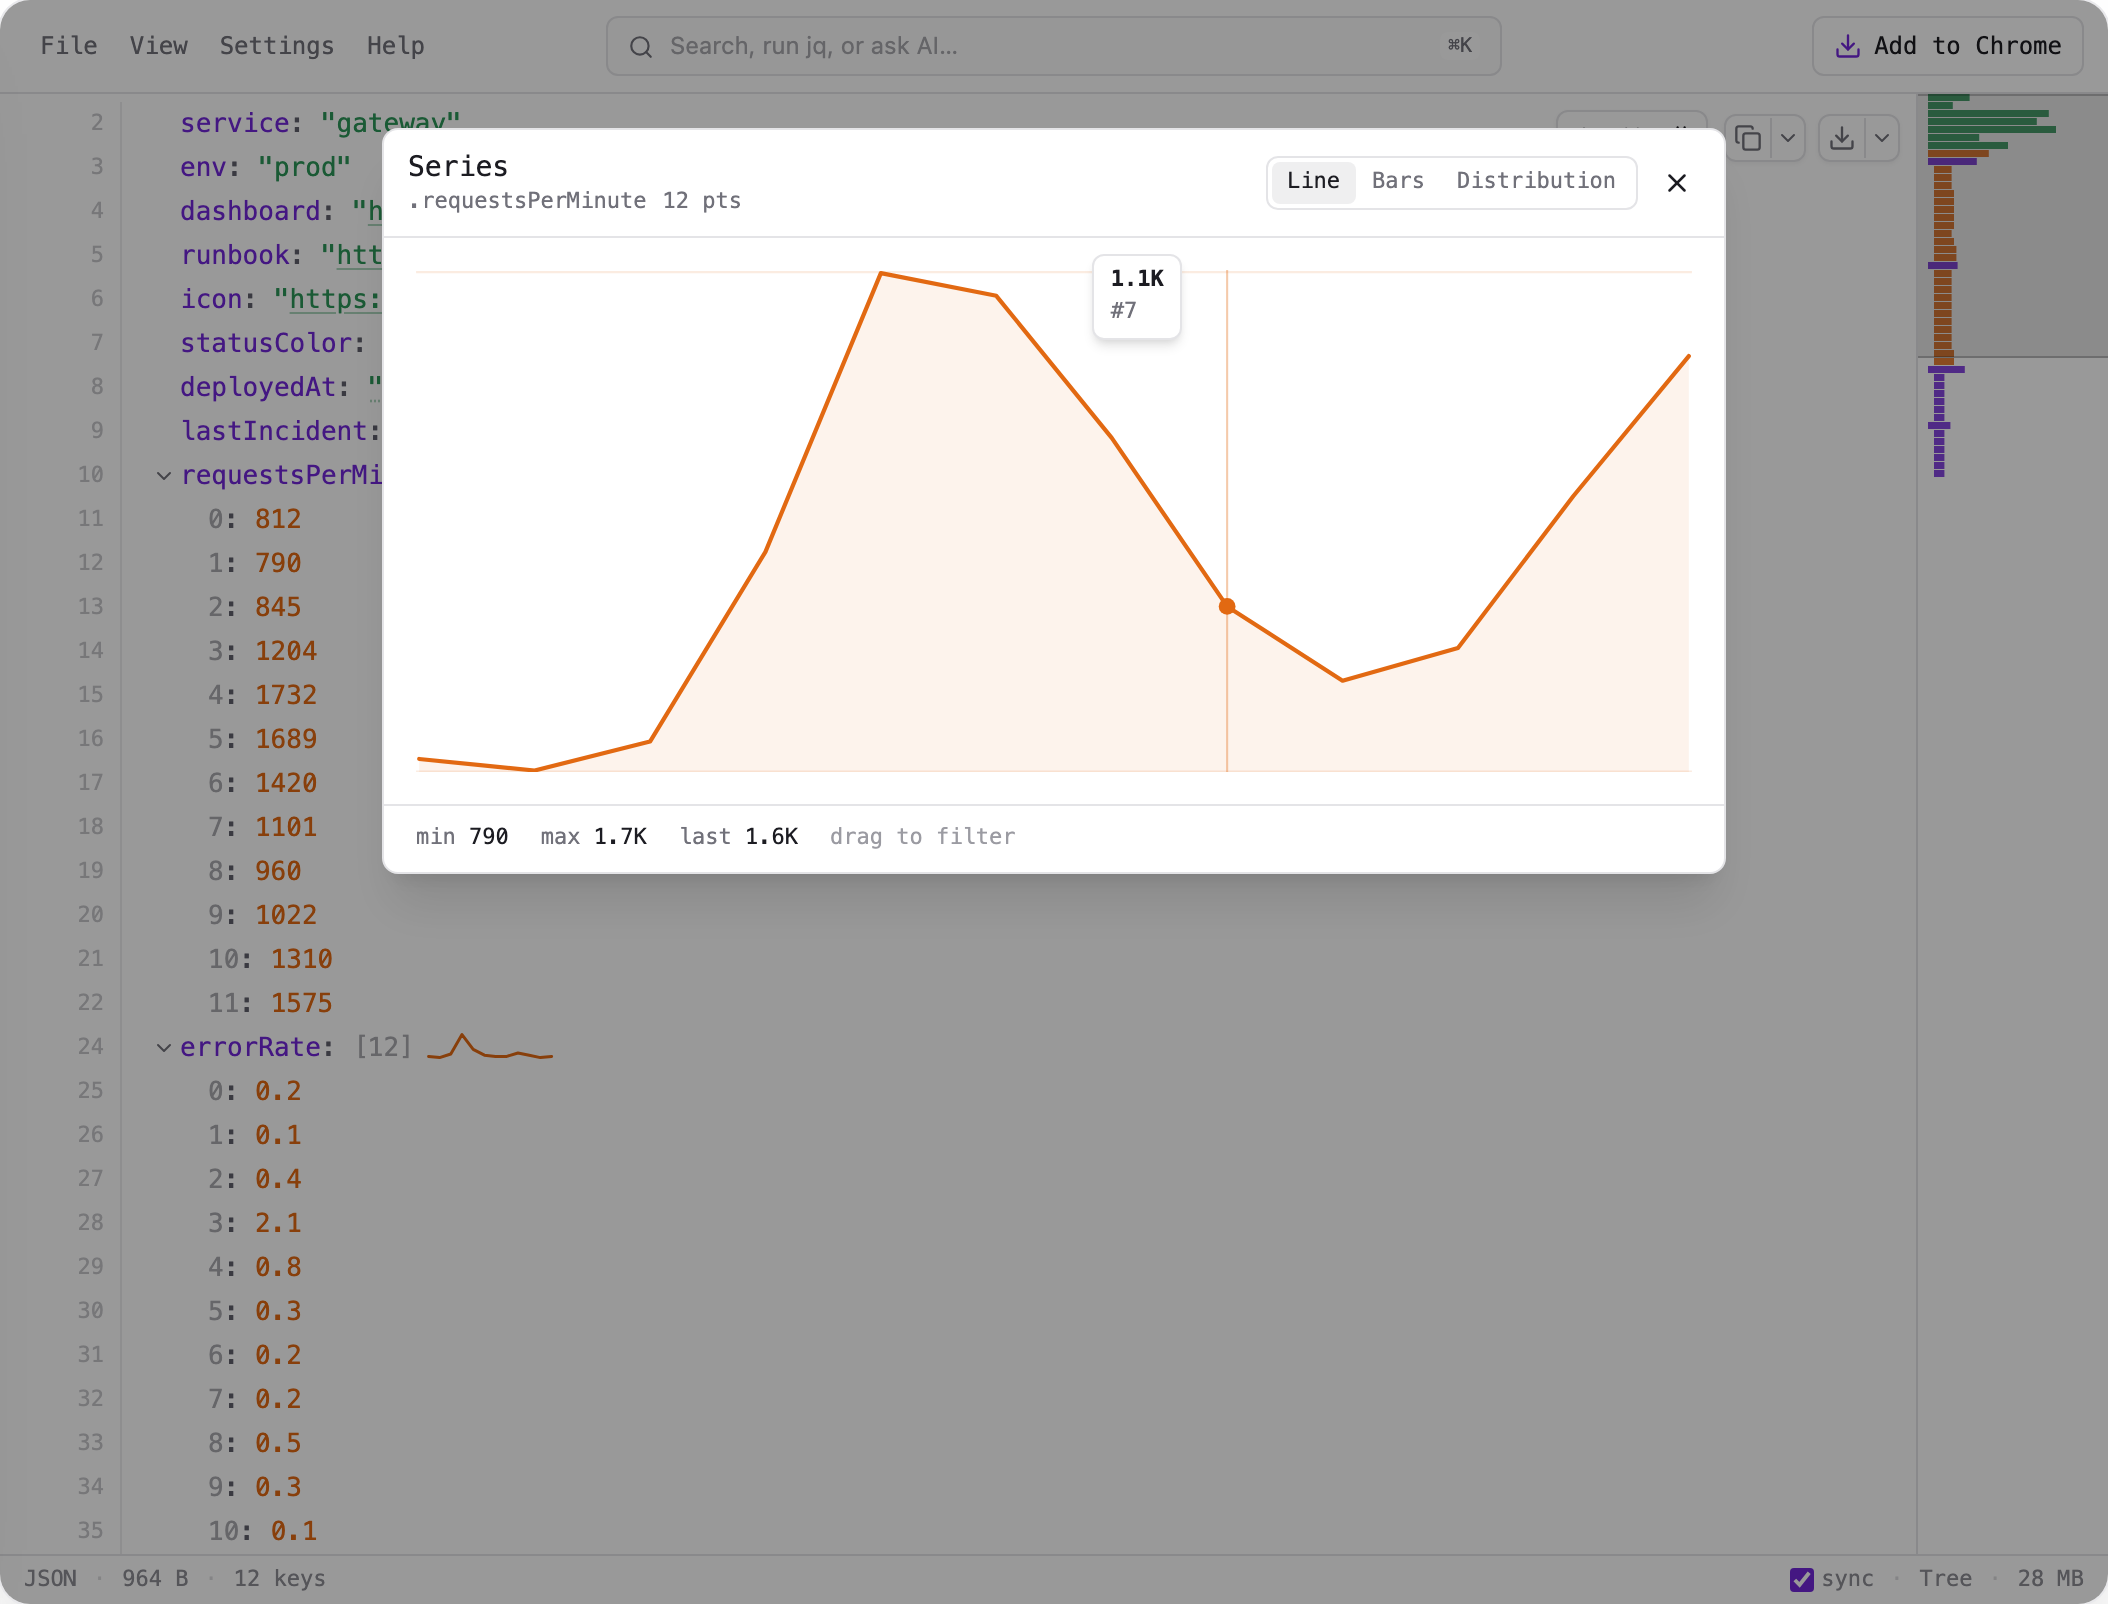
Detection needs at least four points, tolerates the odd malformed row, and samples very large arrays (about a thousand points) so a million-element series previews instantly. The stats and the chart describe the sample in that case, not every raw point.
Series and images also act as an object's hero: select a record in the Columns view and its logo or avatar renders large in the detail panel — or its series renders as the chart card — above the field list. In the Graph view, a series array becomes a chart card outright: the elements are the curve, so the card shows the chart instead of a row per element.
Previews in the graph
The Graph view mirrors the same idea: each node card shows a representative field or a container peek for its links, and hovering a link row opens the same popover you get in the tree — so you can read a graph without expanding every node.
Tune it in Tree settings
Open the gear icon and go to the Tree tab to control how values and previews render:
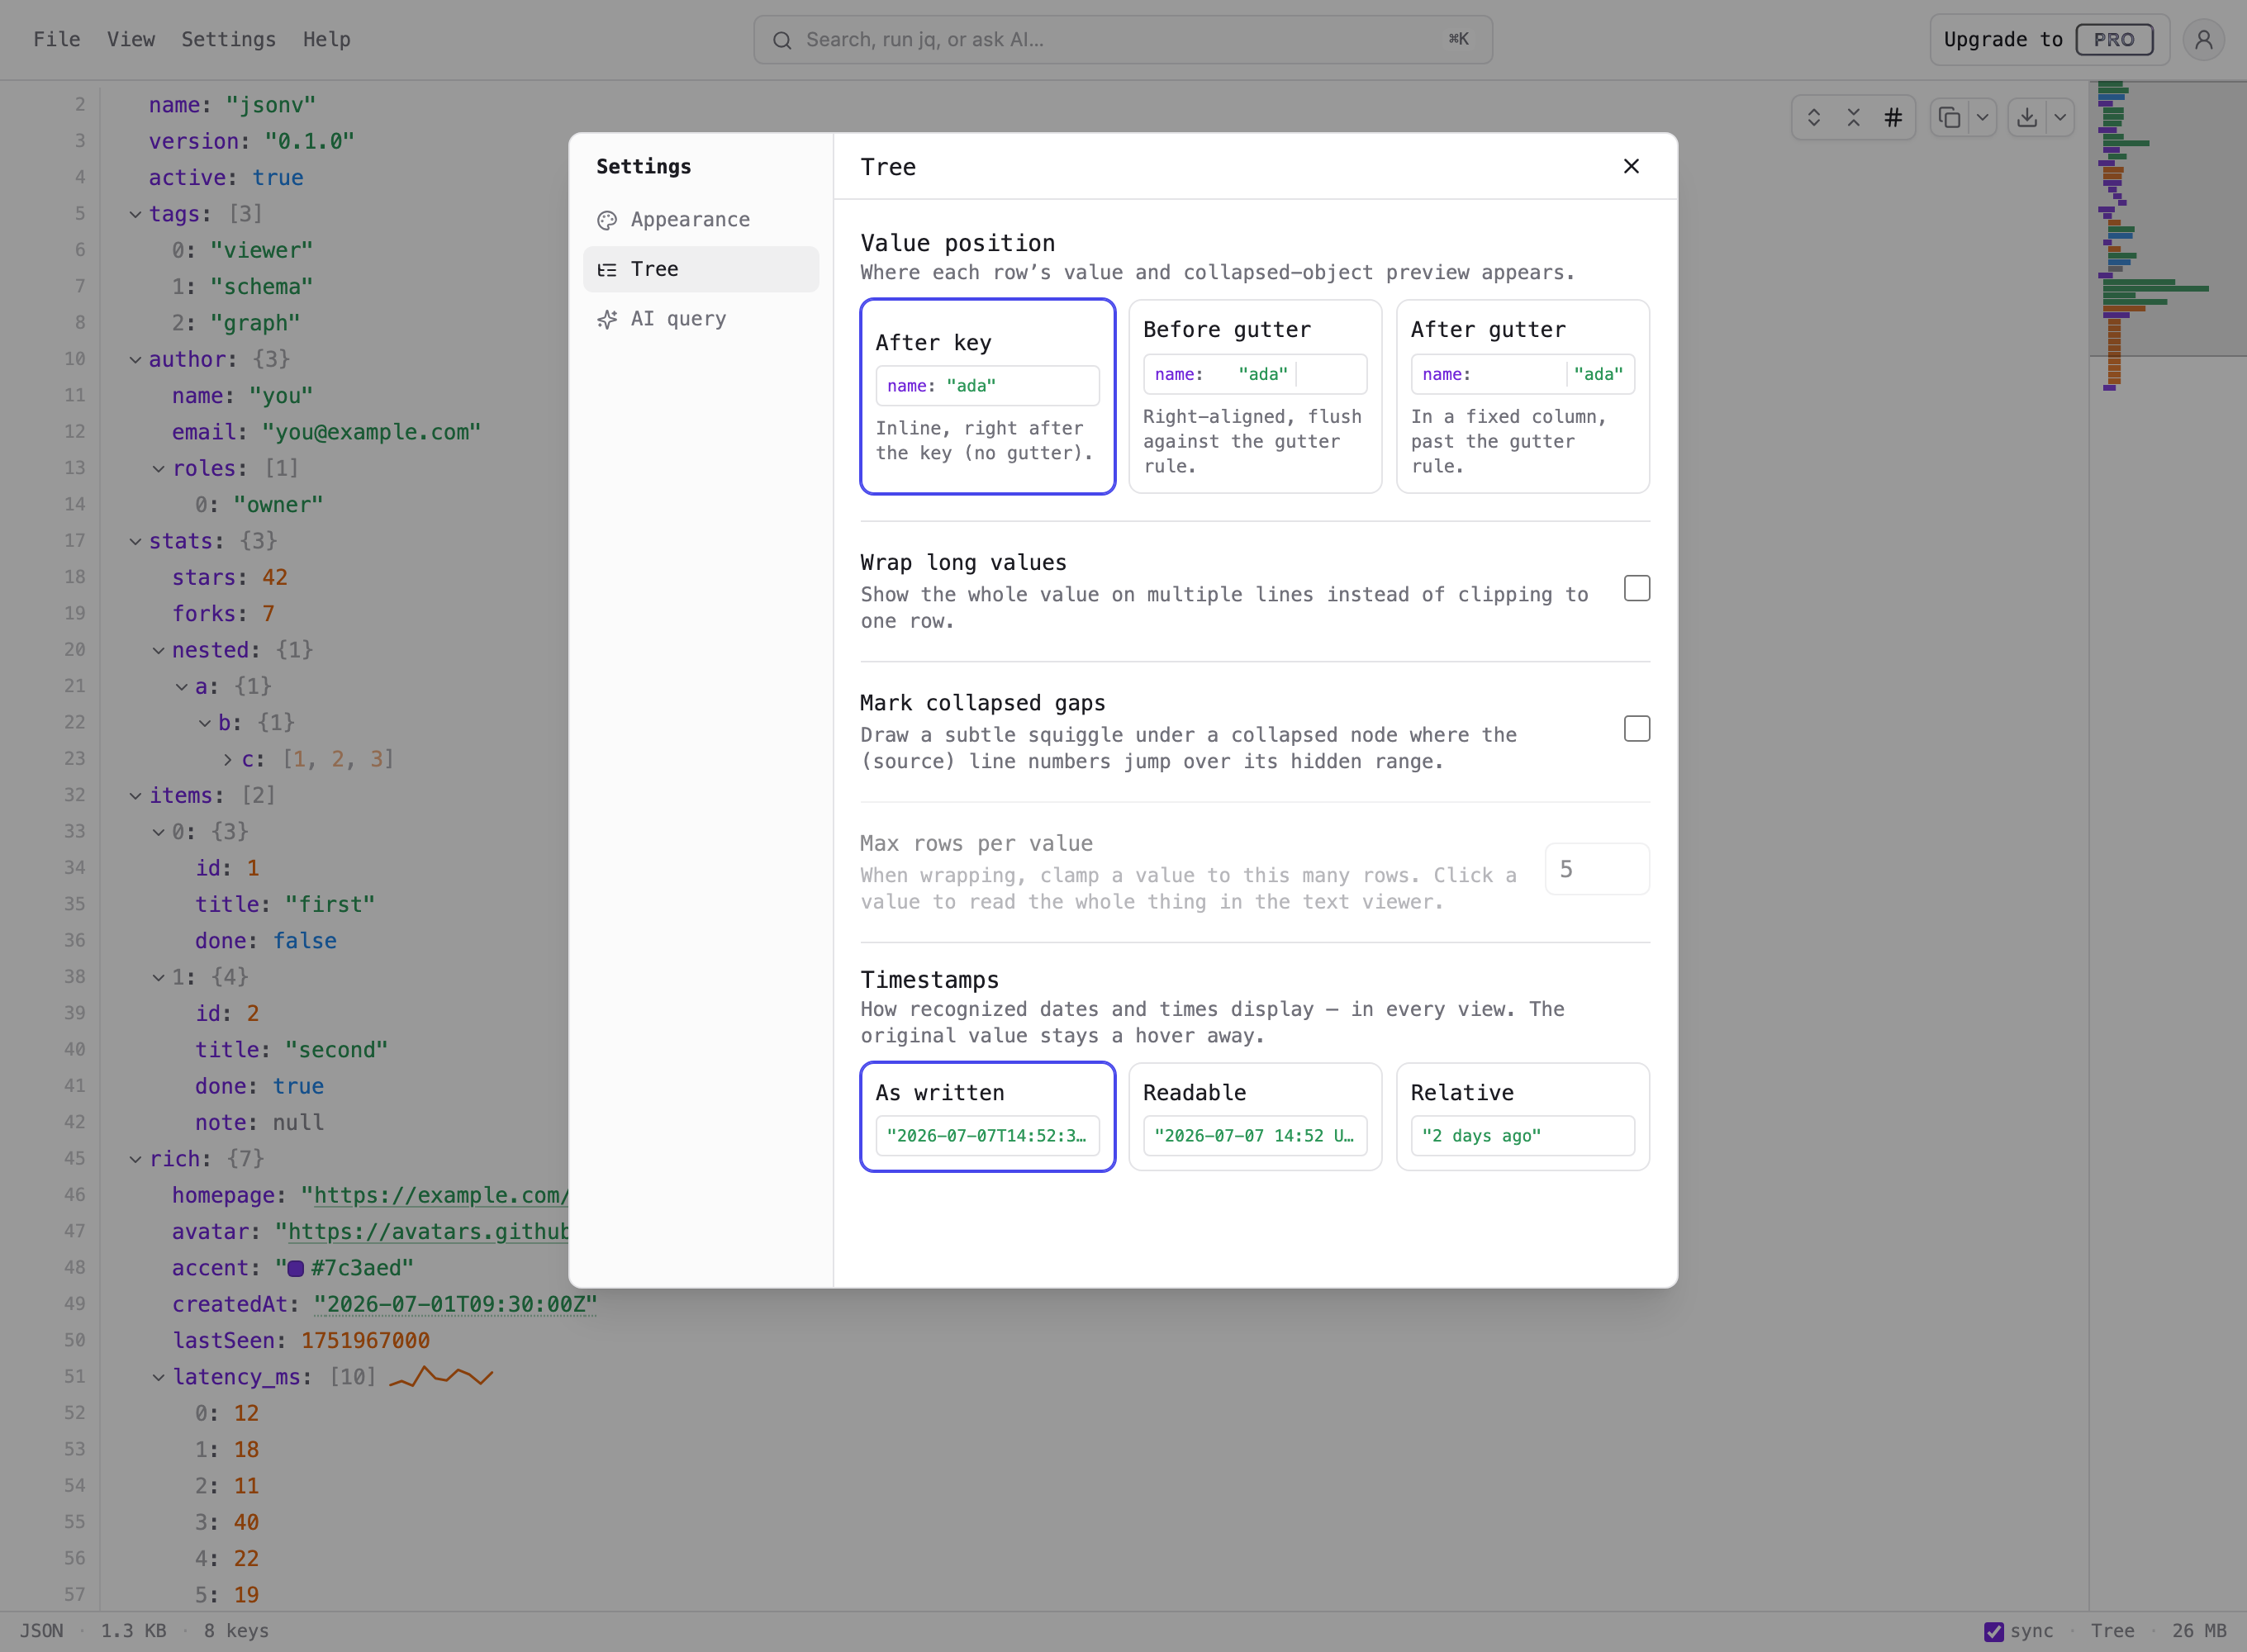
You can also drag the gutter rule to resize where values sit. Previews themselves are always on for collapsed containers — there's no need to enable them.
Previews let you read a document's shape at a glance — no clicking required.